- Published on
Building an Adobe Analytics Metrics & Dimensions definitions page with the Adobe Analytics API
- Authors
- Name
- Perpetua Digital
- john@perpetua.digital


A lot of people in my organization need to know what Adobe metrics and dimensions mean. They should not have to know how to go into the Report Suites Admin section to get this information. Data Warehouse and other such raw data consumers don’t get nicely named events and dimensions like User Login and Article Name; they get event304 and eVar6. I used the Adobe Analytics API to build a simple, unauthenticated (no Adobe login required) page where people can quickly and easily look up what all these data points mean.
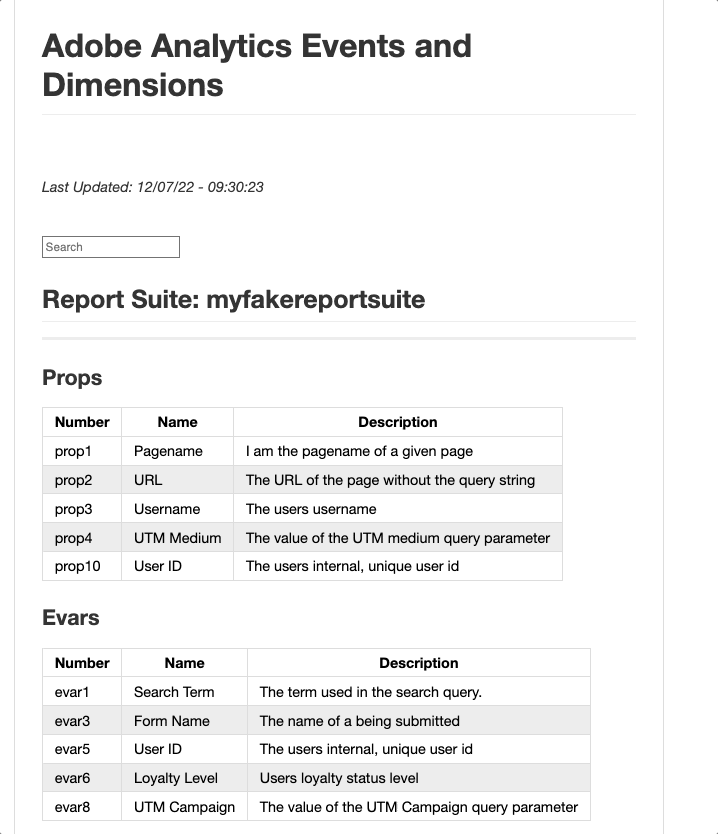
Here is an example of what I built in my organization (with fake data of course):
https://johndavidsimmons.github.io/adobevargrid/adobevargrid
Here is a link to the code on Github:
https://github.com/johndavidsimmons/adobevargrid
Preamble
First things first, before I can do anything with the Adobe Analytics API (or any Adobe API), I need to setup a new project in the developer console. This process will generate the necessary keys I need to make API calls. If you have never done it before, check out the tutorials here: https://developer.adobe.com/developer-console/
I did my last Adobe API project in Node, so I’ll do this one in Python. I will also award myself bonus points for not using the Adobe Analytics Python library. I am going to skip over some of the basic Python setup stuff like virtual environments and installing packages. If you are interested in getting started with Python, I suggest checking out realpython.com.
The beginning of the end…
For this project its actually easier to start at the end and work backwards. Namely, what do I want to this site to look like and where do I want do host it? The looks are not so important, but the ease of automation and security are paramount. I want this page to update automatically and I only want it available to my organization’s users (aka people on the company VPN).
Enter Github Pages. Github pages are the perfect place to host analytics documentation because they let you host static content written in Markdown or plain HTML. Also, since you likely have an enterprise github account, they have the added benefit of sitting behind your corporate VPN and are thus only available to your fellow VPN users. Another great thing about Github pages is that you can tie their deployment to branch updates. This is crucial to the automation process. More on that later.
Authenticating
Before I can actually communicate with Adobe Analytics via the API, I need to authenticate. This done by exchanging the API credentials I created in the developer console for a JSON Web Token. Adobe’s documentation on JWT exchange can be found here: https://developer.adobe.com/analytics-apis/docs/2.0/guides/jwt/.
I am borrowing a lot from the Python example in their documentation.
By exchanging my API credentials for a JWT token, I will in turn receive an access token which I can then use to make Adobe Analytics API calls.
def get_jwt(scope):
    """Encodes AA API creds into a JWT token"""
    payload:dict = {
        "exp": datetime.datetime.utcnow() + datetime.timedelta(seconds=30), # 30 second expiration for JWT
        "iss": org_id,
        "sub": tech_acct_id,
        f"https://{ims_host}/s/{scope}": True,
        "aud": f"https://{ims_host}/c/{client_id}"
    }

    # Encode the payload & sign with private key
    return jwt.encode(payload, str.encode(private_key.replace("\\n","\n")), algorithm="RS256")

def get_access_token(jwt_token):
    """Requests and access token from Adobe for use in API calls"""
    access_payload:dict = {
        "client_id": client_id,
        "client_secret": client_secret,
        "jwt_token": jwt_token
    }

    # Send the JWT in exchange for an access token
    # I have disabled verification here due to firewall complications
    r = requests.post(
        ims_exchange, data=access_payload, verify=False
    )
    # this is the token I need to make AA API calls
    return r.json()["access_token"]
Gathering Data
Now that I can authenticate, I can ask Adobe to give me information about the metrics and dimensions for a specific report suite. Props and Evars can be found in the dimensions method and Events can be found in the Metrics Method. These methods both send a lot of data. I my case I only need the basics so I am filtering extraneous things like OOTB metrics, product events, entry/exit props, etc. I am also filtering out unused metrics and dimensions. Therefore, if I see an event, prop, or evar number not in my list, then it is available for use!
jwt_token = get_jwt(aa_scope)
access_token = get_access_token(jwt_token)

headers = {
    "accept": "application/json",
    "x-proxy-global-company-id": global_company_id,
    "x-api-key": client_id,
    "Authorization": f"Bearer {access_token}"
}

r = requests.get(f"https://analytics.adobe.io/api/{global_company_id}/dimensions?rsid={rsid}", headers=headers)
dimensions = r.json()
props = filter(lambda dimension: dimension.get('extraTitleInfo') is not None and "prop" in dimension.get('extraTitleInfo'), dimensions)
filtered_props = [prop for prop in props if "entry" not in prop['id'] and "exit" not in prop['id']]
evars = filter(lambda dimension: dimension.get('extraTitleInfo') is not None and "evar" in dimension.get('extraTitleInfo'), dimensions)

# order props in numerical order
def order_nums(dimension):
    id = dimension.get('id')
    regex = r"\d+"
    return int(re.findall(regex,id).pop())

filtered_props.sort(key=order_nums)

# for prop in filtered_props:
    # print(prop)

    # returns:
    # {'id': 'variables/prop1', 'title': 'pagename', 'name': 'pagename', 'type': 'string', .....
    # {'id': 'variables/prop2', 'title': 'username', 'name': 'username', 'type': 'string', .....
    # {'id': 'variables/prop3', 'title': 'url', 'name': 'url', 'type': 'string', .....
    # etc etc
    # similar output for evars

m = requests.get(f"https://analytics.adobe.io/api/{global_company_id}/metrics?rsid={rsid}", headers=headers)
metrics = m.json()
events = list(filter(lambda event: event.get("extraTitleInfo") is not None and "event" in event.get("extraTitleInfo"), metrics))
events.sort(key=order_nums)

# for event in events:
    # print(event)

    # returns:
    # {'id': 'metrics/event1', 'title': 'Pageview', 'name': 'Pageview', 'type': 'int', 'extraTitleInfo': 'event1',....
    # {'id': 'metrics/event2', 'title': 'Login', 'name': 'Login', 'type': 'int', 'extraTitleInfo': 'event2', ....
    # {'id': 'metrics/event3', 'title': 'Click', 'name': 'Click', 'type': 'int', 'extraTitleInfo': 'event3', ....
    # etc etc
Building Markdown
Markdown is great because it allows you to build HTML elements with a simplified syntax. However, you can also mix and match standard HTML elements should the need arise. Python is great because you can programmatically build markdown files. What I am going to do here is essentially build a giant string of markdown step by step with all my data then save the entire string to a file. An important thing to remember is that Markdown takes whitespace into account between elements; hence my use of multi-line strings. If things come out looking funky, make sure your spacing is correct. First lets start with a head section. I will address the functionality of the search bar later
last_update = datetime.datetime.now() - datetime.timedelta(hours=4) # adjust for utc time of automation server

output = f"""
# Adobe Analytics Events and Dimensions
<br>
*Last Updated: {last_update.strftime("%x - %X")}*
<div id="variablesearch">
    <input name="search" placeholder="Search" value="">
</div>

## Report Suite: {rsid}
<hr>"""
Since I already have all the data I need from the API, all thats left is to make it presentable. I’ll use Markdown tables for this. The gist is: setup the heading for the table, loop through my Adobe data to create table rows, add some spacing for the next table, repeat. There will be 3 tables: props, evars, and events. Remember that I am creating a giant string of markdown, so when adding the tables I am adding to the output string I already created in the heading section.
output += """
### Props
| Number | Name | Description |
|----------|----------|----------|"""

for p in filtered_props:
    description = p.get('description')
    # descriptions come with weird formatting sometimes...
    if description:
        description = description.strip().replace("\r", " ").replace("\n", " ")
    id = p.get('id').replace("variables/", "")
    name = p.get('name')
    output += f"\n|{id} | {name} | {description}"

# remember to add spacing between elements in markdown
output += "\n"
output += """

### Evars

| Number | Name | Description |
|----------|----------|----------|"""

for e in evars:
    description = e.get('description')
    if description:
        description = description.strip().replace("\r", " ").replace("\n", " ")
    id = e.get('id').replace("variables/", "")
    name = e.get('name')
    output += f"\n|{id}|{name}|{description}|"

output += "\n"
output += """

### Events

| Number | Name | Description |
|----------|----------|----------|"""

for e in list(events):
    description = e.get('description')
    if description:
        description = description.strip().replace("\r", " ").replace("\n", " ")
    id = e.get('id').replace("metrics/", "")
    name = e.get('name')
    output += f"\n|{id}|{name}|{description}|"
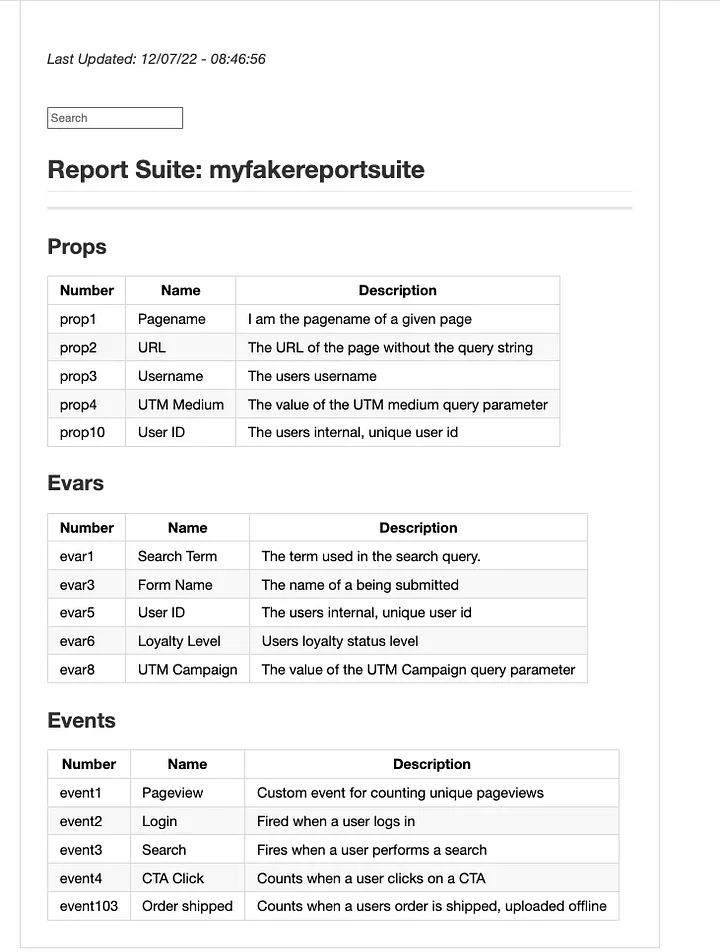
These are all fake, but this is the exact output format I want. This is also truncated for brevity. A real report suite will likely have hundreds of rows.
Style & Search
When there are hundreds of rows the table needs some color to break it up. You can add styling to the output in plain HTML since markdown is interpreted by the browser as HTML (the markdown tables become regular HTML tables with columns, rows, etc.). I’ll color every other row just to make it so this thing isn’t a wall of text.
# CSS
output += """
<style>
    tr:nth-child(even) {
        background-color:#ECECEC !important;
    }
</style>
"""
You can apply any style to Markdown just as you would regular HTML elements
To make this table searchable (and actually useful) I need to add a little JS. Once I have it working as expected, I can append it to my markdown string, just like every other element, to have it added to the final output file. Again, since markdown converts into regular HTML you can write javascript to manipulate it. Here, when someone types in the search box, the table will begin filtering for those characters. If there is match in the number, name, or description, it will show only those rows. This is why my search bar element has an HTML id of variablesearch.
'Now when someone asks me “Hey what does event57 mean?” I can say “Go check the Adobe Variable grid!”
# Javascript
output += """
<script>
    document
      .querySelector('#variablesearch input')
      .addEventListener('keyup', (event) => {
        let query = event.target.value.toLowerCase();
        let tds = Array.from(document.querySelectorAll('td'));
        let filtered_tds = tds.filter((td) =>
          td.innerText.toLowerCase().includes(query)
        );
        tds.forEach(
          (element) => (element.parentElement.style.display = 'none')
        );
        filtered_tds.forEach((element) => {
          element.parentElement.style.display = '';
        });
      });
</script>
"""
Saving the string as a file
Now that I have all the markdown and HTML code I need in a single string, I need to save that string as a file. If this file doesn’t exist, it will be created. If it does exist, it will be overwritten with the newest data.
with open('adobevargrid.md', 'w') as f:
    f.write(output)
Automation
The page is “done” technically, but I don’t want to have to update it manually every time I (or any of the other admins in my Adobe Organization) make a change to our metrics and dimensions. I would like this page to be as accurate and up to date as possible. Because Github pages will deploy the latest version of my Markdown file (adobevargrid.md) as a page whenever I push a change, I can keep this page up to date by programmatically running the running the script (app.py which generates adobevargrid.md) and programmatically pushing the latest file to Github.
There are a couple different options here depending on how comfortable you are with the command line and/or if your organization has integrated build tools into Github pushes such as CircleCI. Keeping with today’s theme, lets do it in Python using the GitPython Library. Note that Github credentials must be setup prior to using this code!
import os
from git import Repo

# gh.py
# YOU MUST HAVE .git FILE CONFIGURED CORRECTLY
dir = os.getcwd()
repo = Repo(dir)
repo.git.add(update=True)
repo.index.commit("update vargrid")
origin = repo.remote(name='origin')
origin.push()
So now I have a script that pulls the latest event and dimension data, builds it into a presentable file, and a script that automatically pushes that new file to Github to host it on a Github page. The last step is making it run every day.
I will do this as a cron job on a virtual linux machine from Linode. You could also do this as an AWS Lambda and trigger it daily with AWS EventBridge, but deploying Python environments with dependencies to AWS Lambda is kind of a pain. Here are the steps:
- Create a virtual machine in Linode and install Git, Python, Virtualenv, etc
- Clone my repo onto the virtual machine and navigate to the directory
- Transfer my environment variables (API keys) to the virtual machine either by entering them directly or using a .env file
- Create a virtualenv and install the dependencies from requirements.txt
- Run app.py once to confirm it works
- Run gh.py once to ensure it works
- Navigate to my VM’s crontab file and add the following line to the end:
# etc
# etc
# m h dom mon dow
0 8 * * * cd /adobevargrid && . venv/bin/activate && python app.py && python gh.py
Now every day at 8am my virtual machine will pull the latest metrics and events definitions directly from Adobe, build a new markdown page out of them, and automatically push that change to Github. When Github receives this change, it will transform that markdown into a viewable page via Github Pages.
See the an example of the final output here:
https://johndavidsimmons.github.io/adobevargrid/adobevargrid